Know What's Driving Your Business
Prove which investments deliver returns. Forecast revenue and cash flow accurately. Compare performance across locations. Answer board questions in minutes. Data infrastructure that supports valuation and due diligence.

Running a Business Without Complete Intelligence
Revenue is up but you don't know what's driving it. Marketing says campaigns are working but can't prove it. Sales says pipeline is strong but finance can't reconcile it with cash. Each location reports differently. You're making decisions with incomplete information and carrying more risk than you should.
Running Blind
- Investments approved without knowing returns
- Marketing spend you can't tie to revenue
- Locations you can't properly compare
- Forecasts built on incomplete pipeline data
- Board questions that take weeks to answer
- Problems that surface after the damage is done
- Decisions based on gut feeling
Running With Clarity
- Know which investments drive profitable growth
- Marketing spend connected to closed deals
- Portfolio performance in one view
- Cash flow forecasting based on live pipeline
- Questions answered in seconds through Ask Q
- AI Insights that flag problems early
- Decisions backed by complete data
Stop managing with incomplete data. Start leading with clarity.
Ask Q
Ask questions in plain English. Get answers from your data instantly.
Q Insights
Proactive alerts when metrics change. Intelligence delivered, not discovered.
Q Audiences
Analyse your entire customer base, build & sync segments automatically.
Q Acts
Push intelligence to Slack, email, CRM. Data where your team already works.
Why Leaders Choose QZM
Complete visibility across your entire business. Every question answered. Every decision backed by data.
Verifiable Returns
Know which investments deliver profitable growth. Marketing spend tied to revenue. Clear ROI by channel and campaign.
Accurate Forecasts
Revenue and cash flow projections built on live pipeline, historical conversion, and payment patterns.
Early Warning
AI monitors your data and flags what needs attention. Problems surface before they hit your results.
Run Your Business With Complete Visibility
Everything leaders need to see the business clearly and make decisions with confidence.
Answer Board Questions in Seconds
Type any question in plain English. Revenue by channel. Acquisition cost by source. Conversion rates by location. Pipeline by stage. Answer in seconds. Chart, table, or export straight to the board deck.
- Answer any question without waiting for reports
- Compare performance across locations instantly
- Export charts and tables directly to presentations
- Ask follow-up questions without starting over
Every question answered. Every time.Learn More

Problems Flagged Before They Hit Results
Pipeline slowing. Costs rising. Conversion rates shifting. Performance gaps between locations. AI monitors your data and tells you what's changing and why before it shows in quarterly results.
- Know what's changing across the business before you ask
- Spot performance gaps between locations early
- See cost anomalies and revenue shifts in real time
- Weekly intelligence brief delivered to your inbox
Know what's happening before the damage is done.Learn More

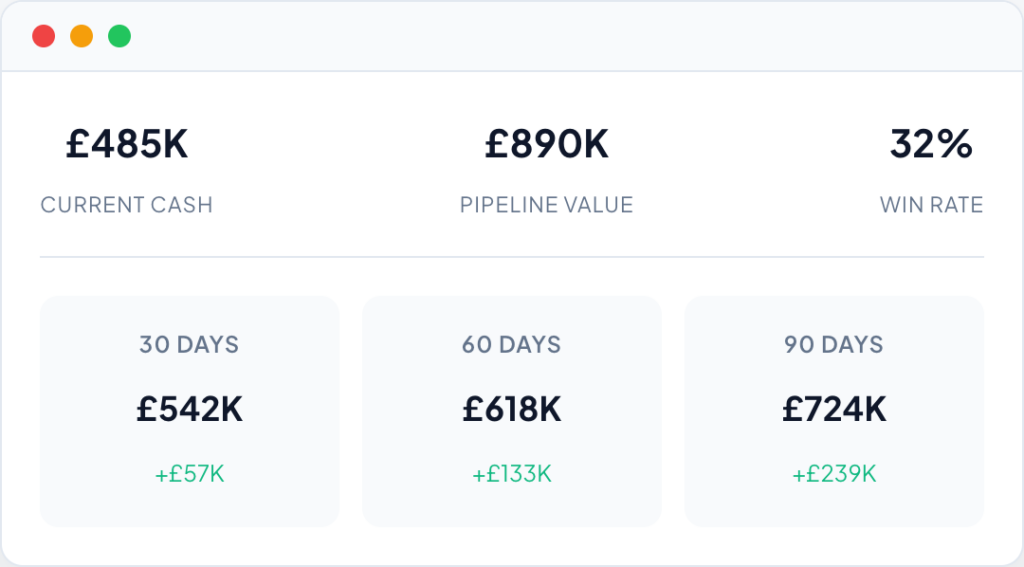
Cash Flow You Can Trust
Revenue projections built on live pipeline, historical conversion rates, and actual payment patterns. See expected cash position 30, 60, and 90 days out. Know when to be confident and when to be cautious.
- Cash position forecasting based on real data
- Pipeline compared to same period last year
- Conversion rates applied from historical patterns
- Payment timing factored into projections
Commit with confidence. Flag risk early.Learn More
Compare Performance Across Locations
Every location reports differently. Different systems, different metrics, different formats. We standardise everything so you can see the portfolio in one view and allocate resources based on data.
- Standardised metrics across all locations
- Revenue, margin, and conversion by site
- Benchmark underperformers against leaders
- Identify where to invest and where to cut
Portfolio performance in one view.Learn More

What We've Delivered
Hours
Saved per month on reporting and data chasing
Marketing Spend
Now tied to revenue
Days
Cash flow visibility ahead
Weeks
From start to complete visibility
Full Executive Intelligence
Questions you can answer when all your business data is connected.
Investment ROI by channel and campaign
Know which marketing investments drive profitable growth.
Revenue and cash flow forecasting
Projections built on pipeline, conversion rates, and payment patterns.
Performance comparison across locations
Standardised metrics let you benchmark and allocate resources.
Customer and segment concentration
See where revenue is concentrated and where you're exposed.
Pipeline health and velocity
Track pipeline vs last year and spot slowdowns early.
Due diligence and valuation support
Clean, connected data ready for acquisition or investment.